Childhood obesity statistics in the UK fluctuate from year to year. Sometimes they go up, sometimes they go down. In the last twenty years, there has not been a strong trend in either direction, but if a journalist wants to give the impression of an ever-worsening ‘epidemic’, it is easy enough to do. There are two main surveys and various different age groups, so you can usually find one indicator that is going up. If that doesn’t work you can switch to other measures, such as ‘severe obesity’ or ‘overweight’. Another approach is to write an article when childhood obesity is going up, but ignore it the following year when it goes down. There are plenty of options.
For example, this Guardian article from 2016 reported a tiny and statistically non-significant rise in obesity prevalence (of 0.2 percentage points!) among 4-5 year olds between 2014/15 and 2015/16, but the Guardian did not report the decline of 0.4 percentage points recorded the previous year. It’s a simple trick and it gives ‘public health’ blowhards an opportunity to tout for policy changes.
The Times mixed things up today by doing the trick in reverse. I have never seen this done before (newspapers prefer bad news), but they cherry-picked the data to make it look like things are getting better.
Obesity rates in England stabilise for first time in two decades
NHS figures reveal childhood obesity has fallen to its lowest level since 2000, while adult obesity remains stable
England has begun to turn the tide on rising obesity for the first time in two decades, NHS figures reveal.
The number of children who are overweight has fallen to the lowest level since 2000, while obesity rates in adults have remained stable for the past five years.
The data from the annual NHS health survey indicates that a trend of gradually expanding waistlines, which has been continuing since records began in 1993, is finally levelling off.
Why is The Times, of all newspapers, telling us this?
This reflects the impact of public health measures such as the sugar tax, as well as growing concerns over ultra-processed foods among the health-conscious middle classes.
Ah yes, the sugar tax. A policy The Times is very keen on, but which didn’t seem to reduce obesity. Have they twigged that if they keep telling us about a spiralling child obesity epidemic then people might start to think that their policies are ineffective?
The figures come from the Health Survey for England and were published today. The evidence for The Times’ claim that adult obesity levels are now ‘stable’ is that:
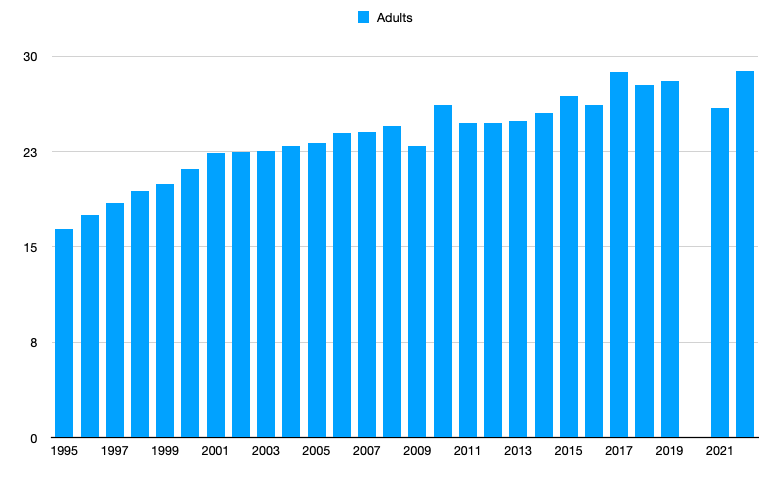
The proportion who are obese, meaning their BMI is above 30, has remained at 29 per cent for the past five years.
The figures are shown below. To be precise, the adult obesity estimate for 2022 is 28.9% which is the highest on record, although it has been there or thereabouts for the last six years so The Times is broadly correct.
But if you look at the period between 2001 and 2009, it looked like obesity had “levelled off”. If you take the period between 2010 and 2016, it looked like it was “stable”. In each case, the figures crept up again. At some point, obesity rates must level off, but it is far too early to say that has happened.
The story of (adult) obesity in the UK in the 21st century has been a very gradual rise in prevalence from 23% to 29%. The rise has been much smaller than predicted, but there is no real sign of it stopping. Without the need to justify the sugar tax, I suspect The Times’ headline would have been ‘Obesity reaches record high’.
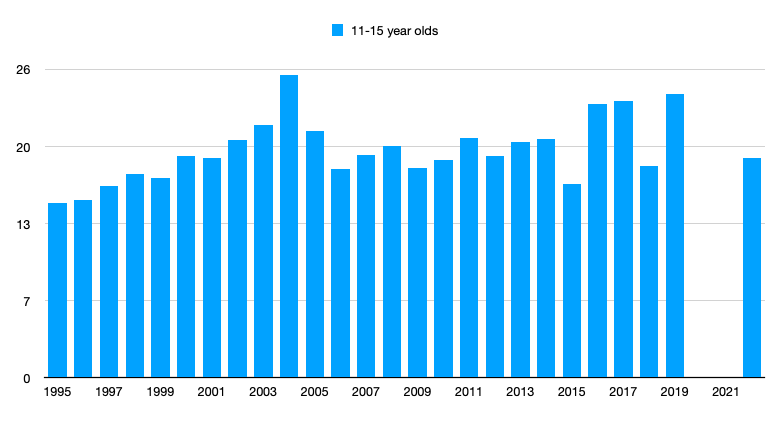
What about the children? The figures from 2 to 15 year olds are shown below.
The figure for 2022 is not the lowest in 20 years, but it is one of the lowest. However, it was lower in 2012 and 2015 and no one was claiming that the tide had turned on childhood obesity. Overall, child obesity seems to have been lower in the last ten years than at its peak in 2004-05, but we can’t say much more than that.
Looking at the 2 to 10 year olds, we can see that the 2022 figure is pretty average in the context of the last ten years.
Among the older group, the 2022 figure is slightly lower than average but nothing to write home about.
The sub-heading of The Times article says “childhood obesity has fallen to its lowest level since 2000”. As we have seen, that is not true, but the text of the article makes a different claim…
The number of children who are overweight has fallen to the lowest level since 2000
Regular readers will know that, thanks to statistical chicanery, children in the UK who are arbitrarily classified as obese are very often not fat. Children who are classified as overweight (but not obese) are almost never fat. It is a completely worthless and meaningless category. Nevertheless, we collect data on it, so here it is…
The figure for 2022 is 12.0% which is higher than in 2016 when it was 11.7% so the claim in The Times isn’t quite true, but it is nearly true. It doesn’t really matter because being technically ‘overweight’ has no clinical or aesthetic relevance for children, but I would bet a few quid that next year’s figure is higher.
That’s because the reason the 2022 figure is so low is that there was, on paper, a remarkable decline in ‘overweight’ prevalence among 11-15 year old girls. Their rate of ‘overweight’ has been hovering around 16% since records began, but in 2022 it suddenly crashed to 6%. Nothing like this was seen among boys (whose rate went up), nor among younger girls. I am pretty sure it is a statistical artefact due to the small sample size.
The Health Survey for England is a good piece of research and enough adults are interviewed to give a solid estimate of adult obesity, but it only looks at 1,393 children. Start dividing that up by age and gender and you soon have some very small sample sizes that are vulnerable to chance. That’s why the obesity graphs above are so higgeldly-piggeldly. There’s no way you would get so much variation from year to year in practice. For example, here are the obesity estimates for boys aged 10 to 15.
2014: 22%
2015: 18%
2016: 26%
2017: 23%
2018: 19%
2019: 27%
2020-21: NA
2022: 17%
That’s just noise. A much more reliable survey is the National Child Measurement Programme which weighs and measures nearly every child in England in their first and last year of primary school. The NCMP figures vary very little from year to year and have tight confidence intervals.
Notice how rates of child obesity rose sharply during the pandemic (a lack of exercise will do that). Aside from that, since 2006/07 there has been a gradual increase among Year 6 kids and no real change among Reception age kids. There is no suggestion of a tide being turned. Adult obesity is at an all time high, childhood obesity is at its highest level outside of a pandemic, and the best that can be said is that the meaningless category of ‘childhood overweight’ is at its lowest level since 2016.
Great success!


" measures nearly every child in England in their first and last year of primary school"
Those charts are scary because there's a huge link between going to primary school and getting obese by the time you leave. This needs dissecting by the public health academics - does home schooling, state schooling or fee-paying schooling make any difference. Enquiring minds would like to know.